
Over the years, trade in services has grown substantially, witnessing a much more impressive average annual growth rate (5.3%) than merchandise trade (3.4%) between 2005 to 2019. Service trade has played a special role particularly in India’s growth. IT boom, emergence of the BOP sector, advancements in information and communication sector and hospitality services are well known success stories from India’s service sector. In 2020, service trade accounted for 42% of India’s total exports. With this, this article presents a brief analysis of India’s performance in service trade from 2005 to 2020, the most recent years for which data is available.
Table of Contents
Service Trade by World
World export of services grew by an average annual rate of 5.3% between 2005 and 2019, but declined by 20% from 2019 to 2020 as a result of the COVID-19 Pandemic
Trade in services measures the level or the value of services exchanged between two countries. Some examples of service trade include travel services, communication, construction services, financial services etc. Export of services across the world have increased from USD 2.7 trillion in 2005 to USD 6.2 trillion in 2019, an average annual growth rate of 5.3%. World exports of services witnessed a dip in 2020, due to the Covid-19 pandemic, reaching USD 4.9 trillion. The graph below shows world export of services between 2005 and 2020, the most recent years for which data is available.

India’s Performance in Service Trade
India became a net exporter of services, doubling its share in World Exports between 2005 and 2020. India’s service exports grew at an average annual rate of 9%; Impact of Covid-19 Pandemic on India’s service exporters much lower than the world
India’s exports of services grew from USD 52 billion in 2005 to an impressive USD 203 billion in 2020, an increase of nearly 4 times in 15 years. Overall, India’s exports of services grew at an average annual rate of ~9% in the said period, much higher than the world average. With this, India’s share in world export of services has more than doubled from 1.9% in 2005 to 4.1% in 2020.
On the other hand, import of India’s services rose from USD 60 million in 2005 to USD 154 million in 2020. With this, India became a net exporter of services from a net importer and has held this position since 2010, as depicted in the graph below.
As was the case with the rest of the world, both service import and export saw a dip in 2020, but it’s impact on India (5% fall in service exports in 2020 compared to 2019) was much lower than on world (20% decline).

India’s Performance vis-à-vis Other Top Contenders
India is globally the 7th larger exporter of Services, contributing to 16.5% of Asia’s Service Exports and witnessing one of the highest growth rates.
On ranking top exporters of services, it can be seen that India ranks at the 7th position, behind US, UK, Germany, China, Ireland and France (see the graph below). Service exports by US in 2020 were USD 706 billion, nearly twice as much as UK that was at the second position. It is interesting to note that while India ranks at the 7th position, it’s features in the top 3 countries in terms of its average annual growth rate at 8.5% between 2005 and 2020, behind Ireland (9.9%) and Singapore (9.7%) and contributed to 16.5% of Asia’s Service Exports in 2020.

Modes of Service Trade
60% of India’s service exports are generated from Cross-Border Trade, an anomaly when compared to rest of the world.
As per GATS (General Agreement on Trade in Service), trade in services can be split or measured in 4 different modes. These are differentiated based on which territory the supplier and consumer are based (home territory or abroad) and include:
- Cross-border Trade (Mode 1): This occurs when a service is produced in one country but consumed in another. For example, say an IT company in Country A solves IT related issues in Country B, via telecommunication. Or, a lawyer in Country A gives advice through the internet to their client in country B. This is very similar to simple export of goods from one country to another.
- Consumption Abroad (Mode 2): This takes place when the consumer of these services avails the said service in the territory of the supplier. For example, resident of Country A goes to Country B for tourism or for studying.
- Commercial Presence (Mode 3): This is when a company, originally registered in Country A, also establishes its presence in Country B and provides its services in Country B. For example, when a hotel conglomerate opens another outlet in a new country to provide hospitality services.
- Movement of Natural Persons (Mode 4): This takes place when a resident of Country A, travels to Country B to provide a particular service. For example, for example an auditor from Country A might travel abroad to audit the books of their client based in Country B.
The graph below shows India’s service exports bifurcated by 4 different modes from 2005 to 2020[1]. Cross-border Trade (Mode 1) has the highest share at around 60% in 2020, while movement of natural persons (Mode 4) has the lowest, at 6.7%. This is intuitive as India’s success story in the IT sector along with other business services contributes to a high share in service exports. Similarly, with reduction in cost of communication, and high sensitivities around travel of individuals, Mode 4 is expected to have the lowest share.
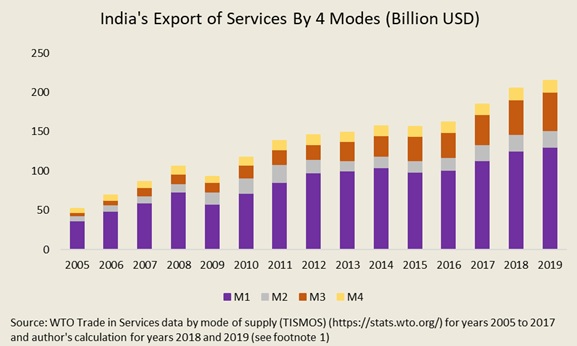
However, an anomaly is seen when we compare India to the world. In 2017, Commercial Presence (Mode 3) accounted for 60% of total service exports while that for India was 20.5%. Though, share of commercial presence has increased over the years (from 8.3%) in 2005, it still remains low. With better availability of data, it would be interesting to see if this ‘Switch of Modes’ – with mode 1 holding majority share compared to Mode 3 – for India is beneficial or not. To do so, looking at the domestic value added and employment created by exports of elements within each of these modes would help understanding the relative importance of these modes. One proxy that could be used for Mode 1 exports is India’s Outward Direct Investment (ODI), that would be able to provide useful complementary information of India’s service export through commercial presence.
[1] Data on Service exports by Modes has been extracted from Trade in Services data by mode of supply (TISMOS), WTO Stats. However, this data is available from 2005 to 2017. Data for 2018 and 2019 is based on author’s calculation. Wherein growth rate in percentage share of Modes is applied to compute proxy values of share of each mode in total exports. This percentage is then applied to total service exports extracted from WTO stats. Year 2020 has been excluded as this was the year when COVID-19 pandemic began to show its impact on international trade and extrapolation of any kind would not be a representation of the true picture.
Acknowledgement: I’m thankful to Anwesha Basu for her very insightful inputs to this piece.